Company forecast

Know where the year is heading — every single day

LivePnL's forecast blends your live actuals with seasonal patterns and your budget, giving you a continuously updated view of the months ahead.

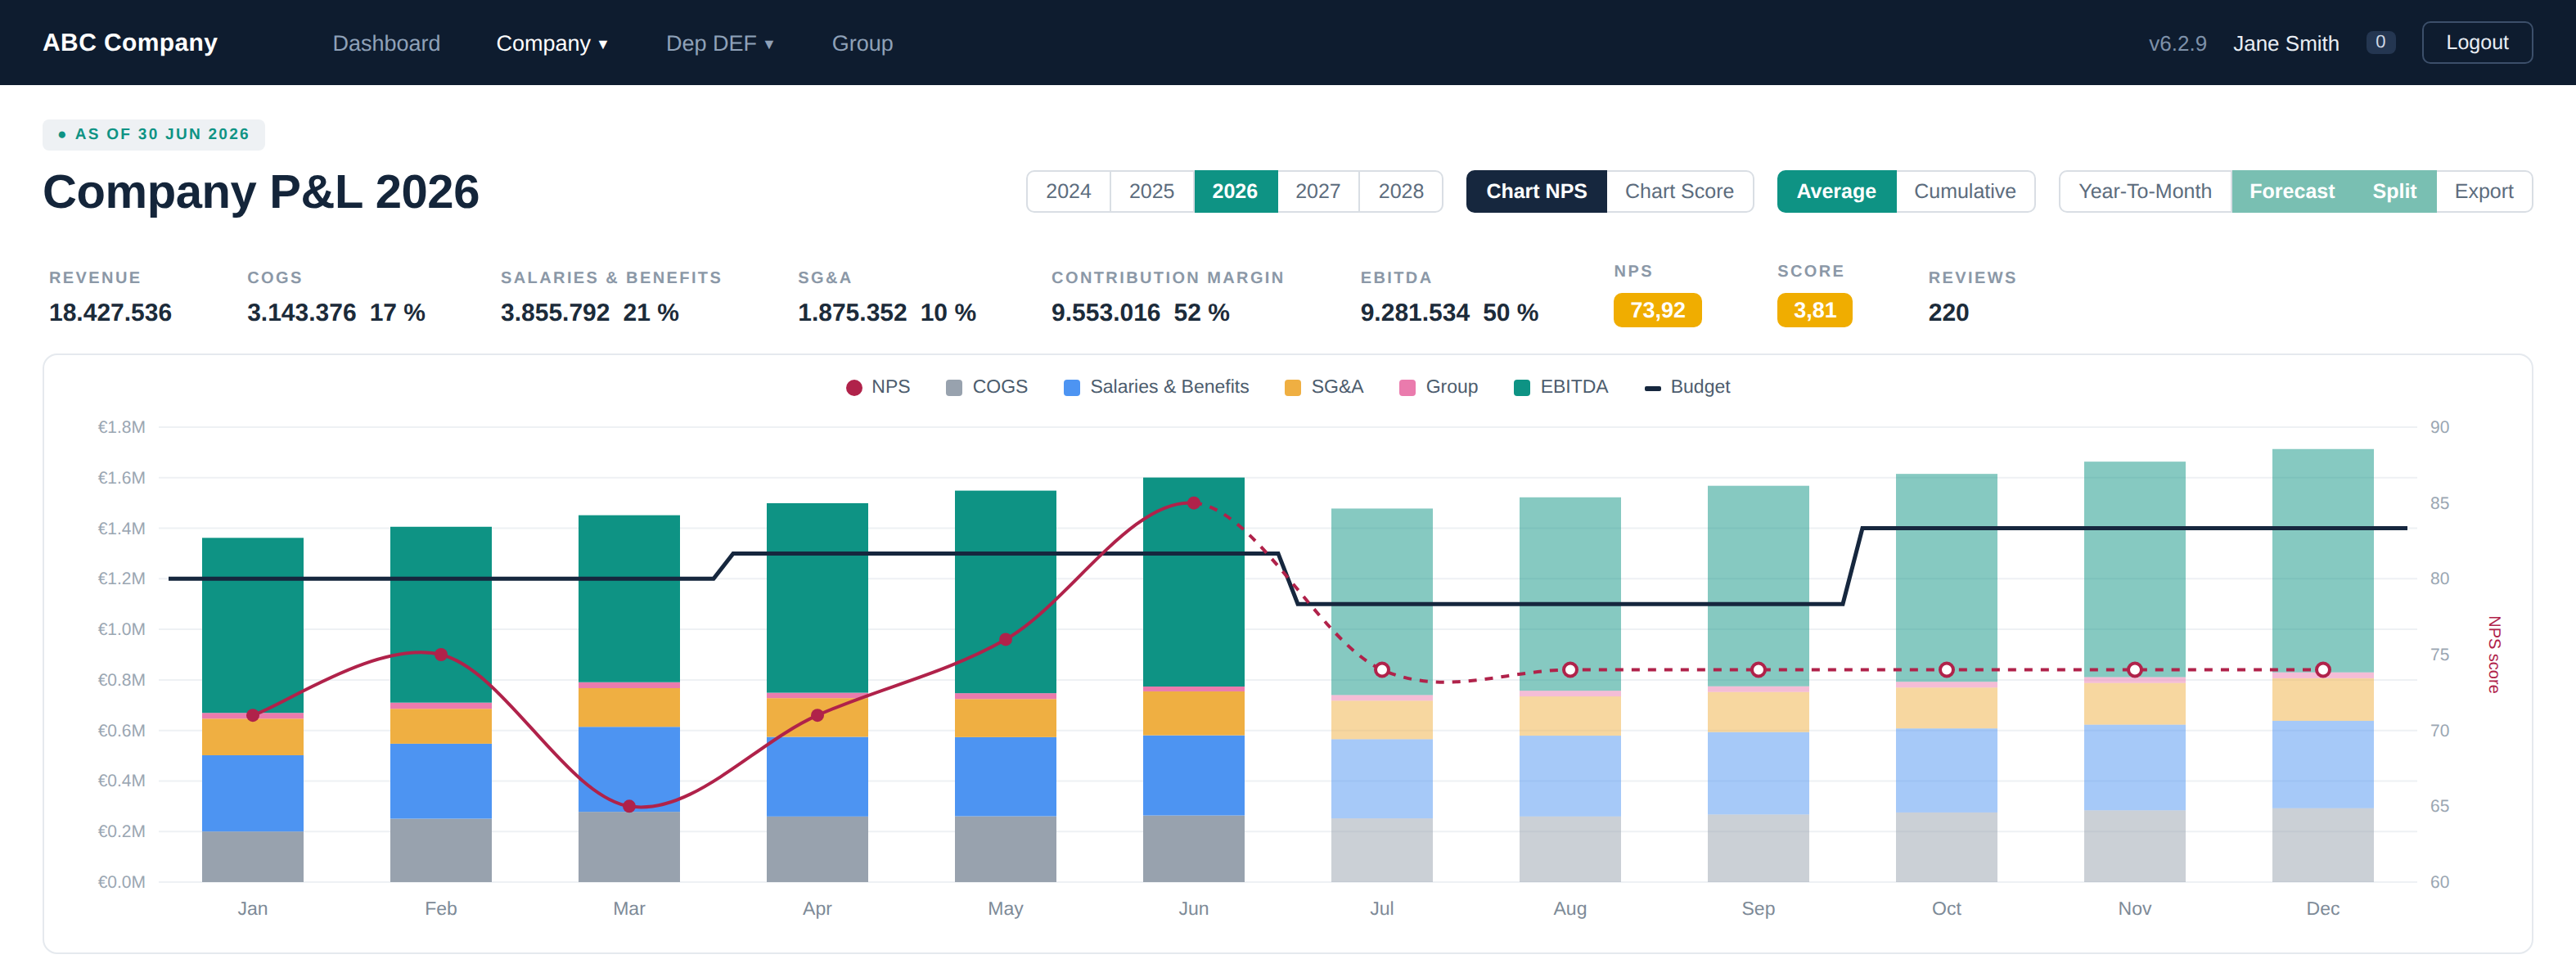
The LivePnL forecast chart: solid bars and a solid NPS line for closed months January–June, lighter bars and a dashed NPS line for the forecast months July–December, with the budget shown as a step line.
Actuals through June, forecast for July–December — lighter bars and a dashed NPS line — with your budget as the step line. The year-end picture updates every day.

Live

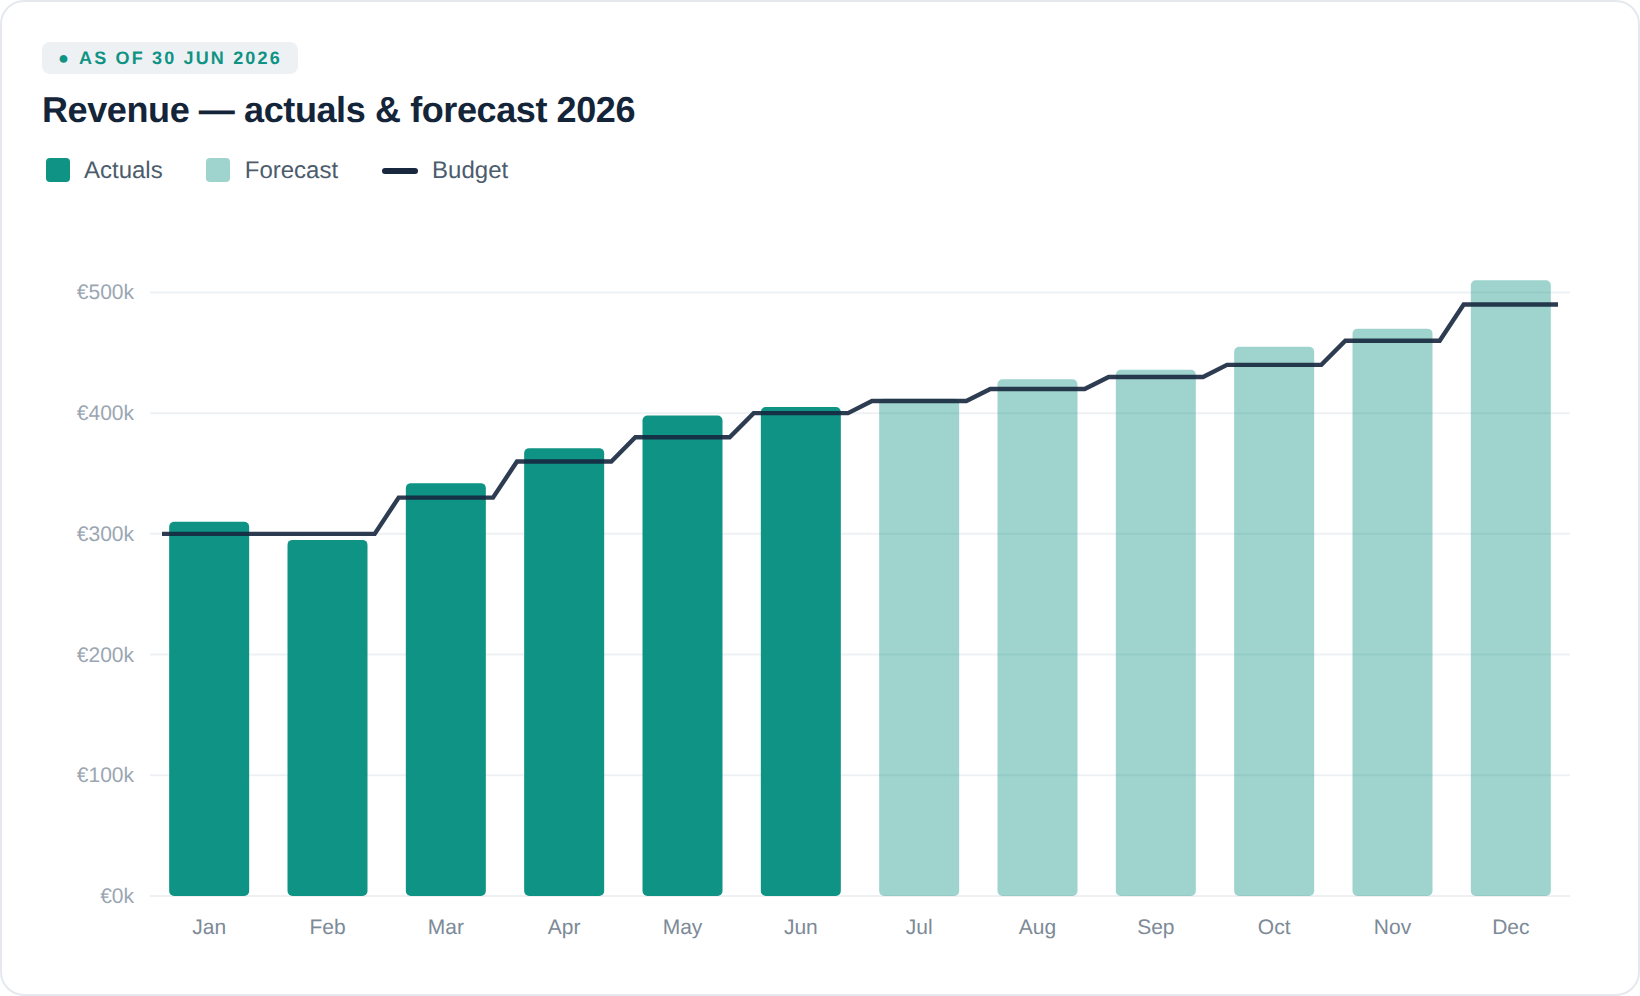
Revenue — actuals & forecast 2026

Rolling forecasts built on your actuals. See projected revenue and profit for the months ahead, and how today's trend changes the year-end picture.
  • Actuals vs budget vs forecastAll three in one view, so gaps surface before they become problems.
  • Updates itselfEvery new day of data refines the projection — no analyst required.
  • Decisions, earlierSpot a slow quarter in week two, not in the quarterly review.
LivePnL revenue chart: solid teal columns for actual months January–June, lighter teal columns for the forecast months July–December, with the budget as a navy step line.

From month-end report to rolling view

A budget set in January describes a company that no longer exists by March. A rolling forecast keeps up.

Built on live actuals

The forecast reads from the same live data as your P&L. There is no separate model to reconcile.

Seasonal patterns

Your own trading history shapes the projection, so a quiet January is not mistaken for a decline.

Budget in context

Your budget stays visible next to actuals and forecast, so variance is obvious rather than excavated.

Every line, forecast to year-end

Not just revenue. Revenue, COGS, margins, salaries, SG&A, EBITDA — even NPS — carry forward as forecast for every month still to close, right down to department level.
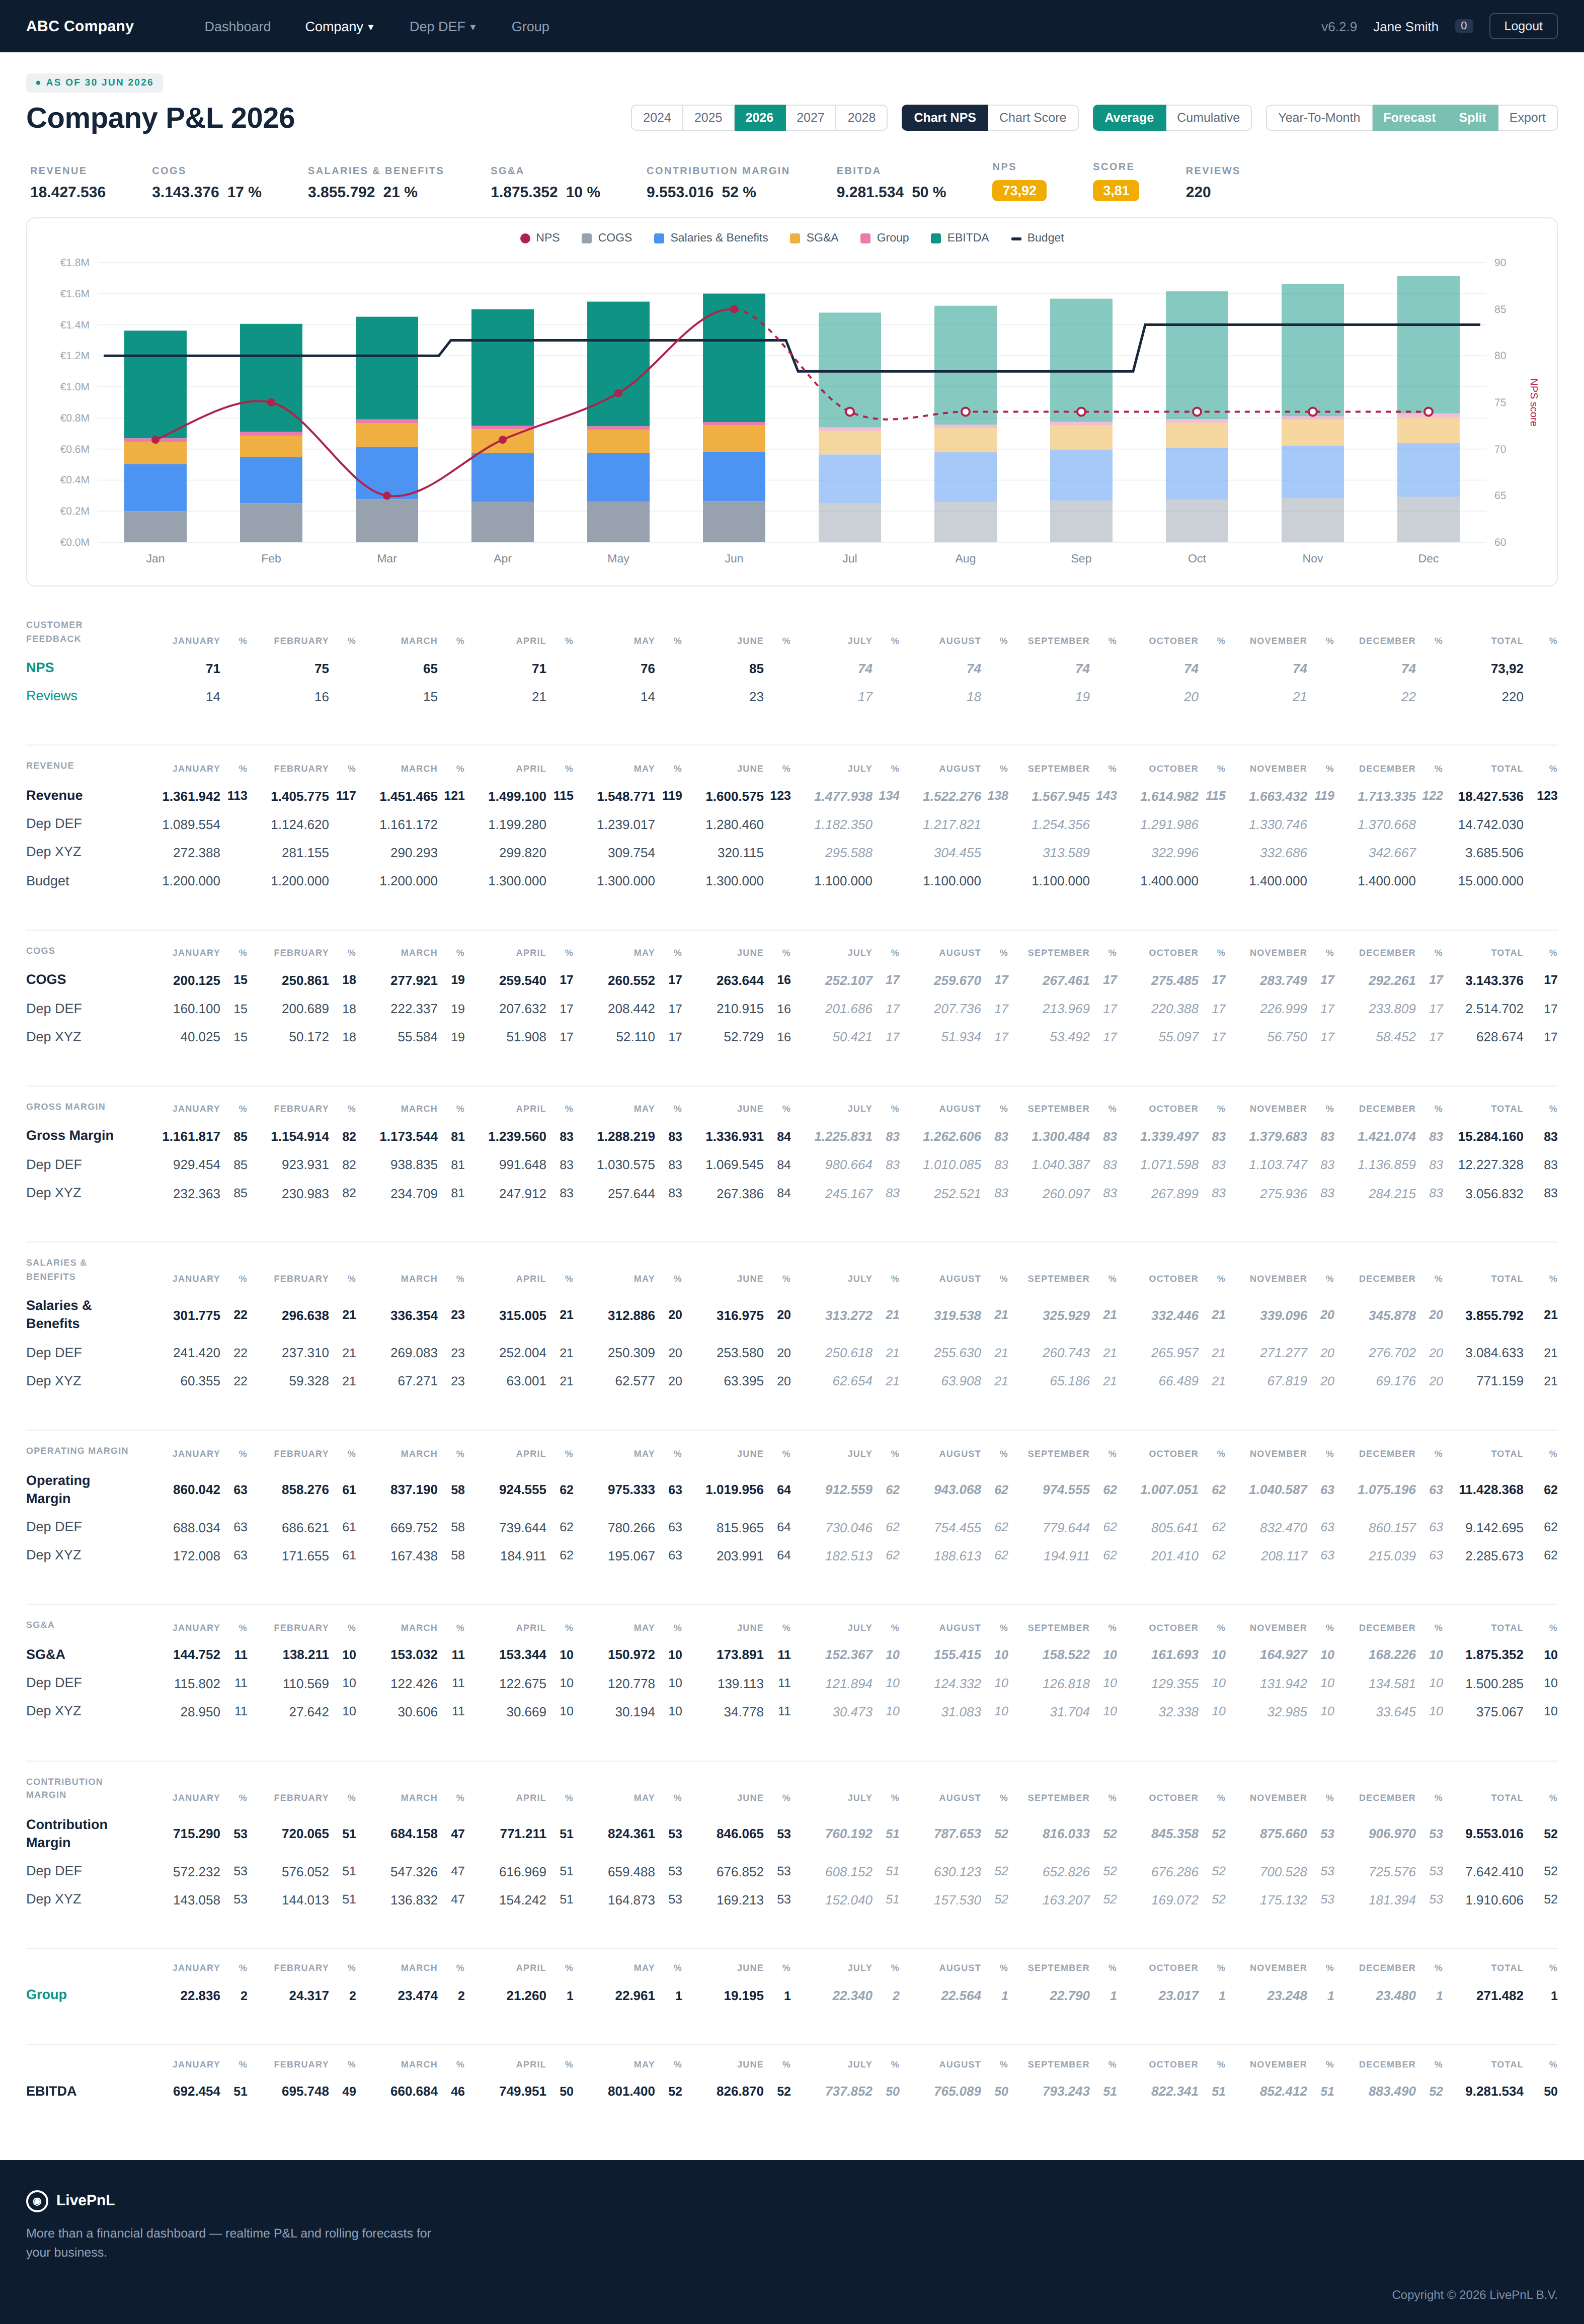
The LivePnL forecast chart: solid bars and a solid NPS line for closed months January–June, lighter bars and a dashed NPS line for the forecast months July–December, with the budget shown as a step line.
The full-year view: every line — revenue, COGS, margins, EBITDA, even NPS — shown as actuals for closed months and forecast (in italics) for the months ahead, per department.

Common questions

What is the forecast based on?

Your own live actuals, blended with seasonal patterns and your budget. Every new day of data refines the projection.

Do we need an analyst to maintain it?

No. The forecast updates itself as data arrives. There is no model for anyone to rebuild each month.

Can we see actuals, budget and forecast together?

Yes — all three in one view, so gaps surface before they become problems.

How far ahead does it project?

Rolling forecasts cover the months ahead through year-end, and update continuously as today's trend changes the picture.

Can we forecast per location?

Yes. Forecasts roll up from location level to group, so you can see which branch is moving the year-end number.

See your own forecast

Tell us a little about your company and we will show you where your year is heading.

See your own P&L live